The charts and passing percentile trendlines that follow were quantitatively derived from the statistical analysis of urine drug test results by cannabis consumers who submitted their drug test results to us. These represent the four most common factors that determine how long marijuana THC metabolites can remain detectable in a user’s body:
- How much a user’s body fat weighs (not total body weight)
- How often a user smokes marijuana
- How fast a user’s metabolism is
- How potent a user’s marijuana is
Urine was tested at a threshold sensitivity level of 50 nanograms of THC metabolites per milliliter, the industry standard. The following is an overview on how data was produced and analyzed to create our Marijuana Drug Test Calculator.
Data was also used for our report on how long marijuana can stay in the body and a detailed, state-by-state analysis on drug test submission rates and racial discrimination.
Statistical Analysis & Linear Regression
Before linear regression analysis of data took place, a Wald–Wolfowitz runs test was performed. The results of this test failed to reject the null hypothesis that our drug test data was submitted by random chance (2 sided p-value = 0.43). In other words, the order in which data was submitted to us was independent of one another and no pattern was identified. This points to data quality, integrity, and allows us to move forward with analysis.
Datasets were separated into two categories, Drug Test Pass and Drug Test Fail, and then further separated into 12 subcategories: Gender, Age, Body Weight (Lbs), Waist (Inches), Body Fat Percent, Body Fat Weight (Lbs), Smoking Frequency, Marijuana Potency, Amount Smoked Each Day, Estimated Metabolic Speed, Cardio Activity Level, and Muscular Composition Level. Outliers within each subcategory were then identified and removed when necessary.
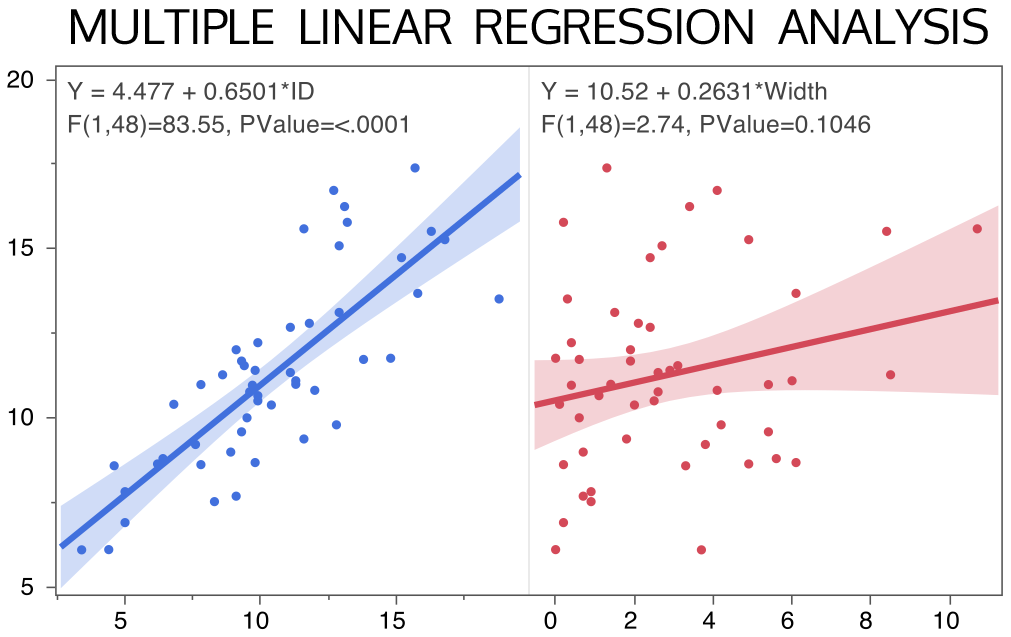
Linear regression analysis was then performed on every single Drug Test Pass/Fail subcategory (96+ variables) in regards to time in Days. Calculations gathered included Regression Statistics (R, Adjusted R^2, etc.) and ANOVA data (Degrees of freedom, T stat, p-value, etc.).

The following are the results, based on subcategory, in terms of the null hypothesis.
REJECTED the null hypothesis that the following variables had no effect on time (p-value < 0.05):
- Body Weight (Lbs)
- Waist (Inches)
- Body Fat Weight (Lbs)
- Smoking Frequency
- Marijuana Potency
- Estimated Metabolic Speed
This means that the above variables are statistically significant and that each one plays a role in determining how long it will take for a cannabis user to pass a urinalysis test.
FAILED TO REJECT the null hypothesis that the following variables had no effect on time (p-value > 0.05):
- Gender
- Age
- Amount Smoked Each Day
- Body Fat Percent
- Cardio Activity Level
- Muscular Composition Level
This means that the above variables are not as important when it comes to passing a drug test or doesn’t have an impact at all.
The six subcategories that rejected the null hypothesis were then re-analyzed together to determine the levels of correlation and covariance. It was identified that Body Weight, Waist, and Body Fat Weight were highly related, as expected.
After further investigation into these three variables, the weight of a person’s body fat (not body weight) was determined to be the best predictor for how long THC metabolites can remain detectable by a standard urine test. This makes sense due to the fact that these metabolites get stored in body fat.
Marijuana THC Charts with Passing Percentile Trendlines
For explanation, if all else were equal and the odds of passing a urine drug test depended on only one factor, such as Smoking Frequency, a point on the 75th percentile trendline means that three out of four people should pass a drug test after that many days. Unfortunately, this is not the case as there are several variables that impact the calculation.
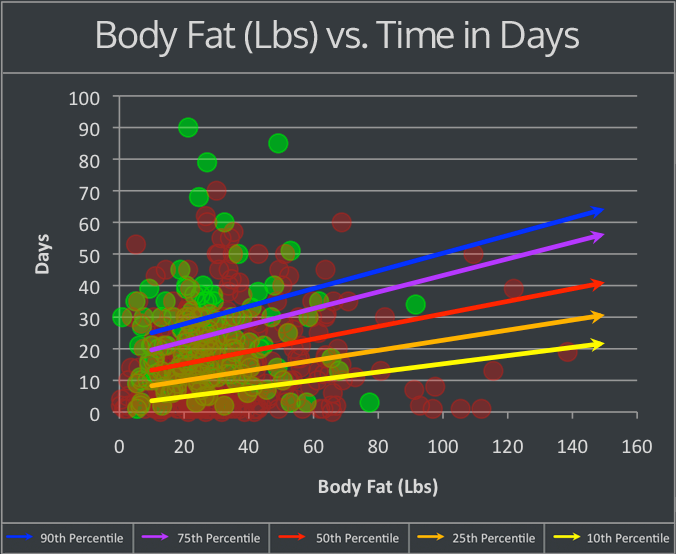
Note: The green and red dots represent Test Negative and Test Positive datapoints, respectively
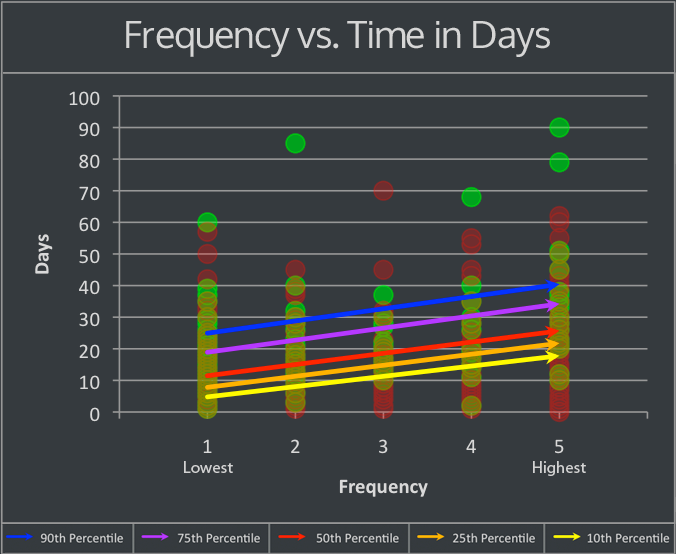
Note: The green and red dots represent Test Negative and Test Positive datapoints, respectively
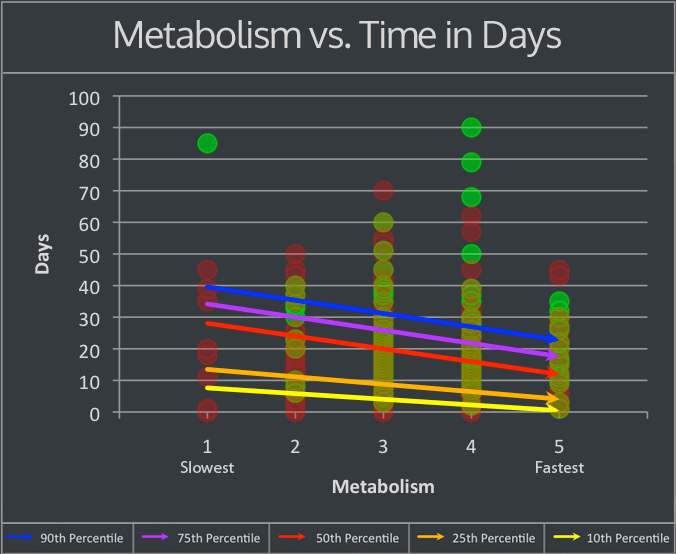
Note: The green and red dots represent Test Negative and Test Positive datapoints, respectively
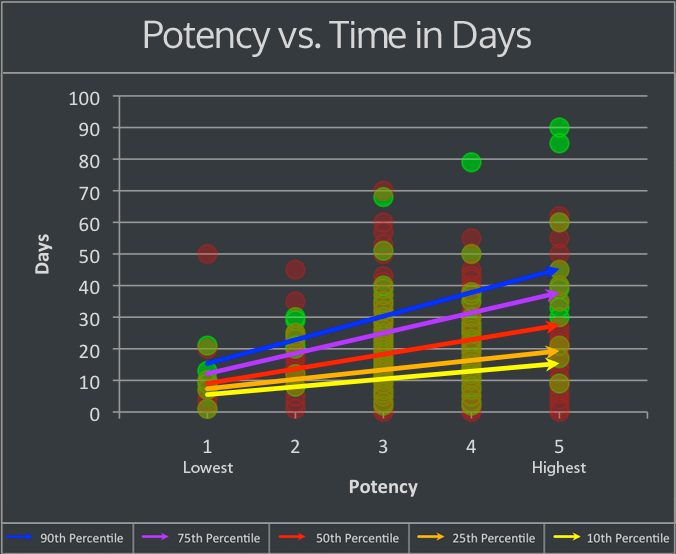
Note: The green and red dots represent Test Negative and Test Positive datapoints, respectively
The percent weight of each variable is also calculated, and is essential to generating the final equations for our calculator.
As stated before, these are the four common factors that impact the probability of when you’ll be able to pass a drug test. These variables are used in all of our passing probability equations: lab test, home test, and their dilution/detox counterparts. Some of the formulas use more than just the four variables. For example, when using the calculator to determine your odds of passing a lab test, seven variables are statistically significant and used.


